Class: Thursday 9 AM - 11 AM EST Instructor: Nil Tuzcu, niltuzcu@gmail.com Zoom: https://sva.zoom.us/j/89966974401 Office Hours: calendly.com/niltuzcu/data-viz-office-hours Class Materials: www.metricsanddatavisualization.com Discussion Platform: Slack #data-metrics-visualization-spring2021
COURSE DESCRIPTION
Metrics and Data Visualization II focuses on telling stories with data to promote social change and civic impact. Together, we will translate data into powerful and engaging visual narratives to make complex political, economic, and social data accessible to the public. Exploring the use of data visualization, design thinking, and narrative building, students will go through every step of creating effective data-driven storytelling tools.
This course is a hands-on and project-based studio supported by critical examinations of various case studies and weekly readings. Each class has lecture and lab components. The students will be paired with individuals and organizations for their course-long digital projects. Each of these individuals and organizations has specific interests in advocating social good and will act as a mentor providing students the opportunity to gain real-world experience working with “clients.” The topics of the projects will range from climate change to social inequalities. As a final deliverable, each student group will design and implement an online visual story composed of data visualizations, maps, images and text.
LEARNING OBJECTIVES
Acquire new knowledge and skills in applying user-centered design methods to complex data platforms that target public sectors and organizations
Critically evaluate data visualizations and storytelling projects and suggest improvements
Understand data visualization tools landscape and learn how to pick the right tools for different purposes
Learn the basics of web development and D3.js data visualization library
Learn different methods to data-driven storytelling and the opportunities and pitfalls of different approaches
Gain practical experience with working with different individuals and organizations and learn to negotiate design strategies.
COURSE COMPONENTS
Each class has lecture and lab components. As we are months into the pandemic, we are all aware of the Zoom meeting difficulties, including different time zones and internet capabilities. Building on the Fall semester’s strategy of having asynchronous lectures, you will have lectures as pre-recorded videos uploaded before each class.
1. LECTURES
Lecture components will introduce the week's main topics and focus on the informational aspect of the topic. Through a series of critical discussions, you will learn the concepts of data-driven storytelling, user experience design principles, and online data platform development.
Quiz:
At the beginning of each class, you will have a short online quiz. The quiz will be based on recorded weekly lectures, assignments, and readings. These quizzes will also be used to take attendance.
Student presentations - Case Studies
In each class, student groups (two or three people) will present an assigned case study. The presentations should take around 15 minutes, have a visual slide-deck, and include three questions for the discussion session. Student groups are required to email their slide deck on Tuesday at 6:00 pm EST for feedback. After the presentations, we will have a short discussion session moderated by the student group and the instructor. LIST OF CASE STUDIES
Student presentations - Weekly Readings
In each class, student groups (two people) will present assigned weekly readings. The presentations should take around 15 minutes, have a visual slide-deck, and include three questions for the discussion session. Student groups are required to email their slide deck on Tuesday at 6:00 pm EST for feedback. After the presentations, we will have a short discussion session moderated by the student group and the instructor. LIST OF WEEKLY READINGS
2. LABS
Lab components will cover data visualization and wireframe prototyping tools, as well as web and data visualization programming tutorials. Labs are interactive tutorials with downloadable code and information from the class website. For programming parts, the labs will introduce front-end web programming with HTML, CSS, Javascript, and D3. Students will be allowed to work in pairs.
3. DESIGN SPRINTS
Some labs will take the form of design sprints. During these sessions, you will work on your group projects through interactive workshops such as storyboarding.
4. IN CLASS ASSIGNMENTS
This class is a hands-on studio. We will have a variety of in-class activities such as improving other people’s visualizations, designing quick visualizations, and creating physical data installation! Students are expected to have plain white paper and pencils of different colors all the time during classes. You will be taking pictures of your design and uploading them to our slack channel!
5. HOMEWORKS
Similar to in-class assignments, students will have short assignments as their homework. Your homework can be a programming exercise or evaluating existing data projects, depending on the week's schedule.
COURSE-LONG PROJECT
The major part of this class is the course-long project in which you will be paired with real-world mentors (“clients”). You will work in groups of 4-5 people.
Classes 2 - 9: First, you will create a data and storytelling strategy according to your mentor’s needs. You will present your design strategy, prototypes, wireframes, data visualization options, and storyboards in the midterm presentations.
Classes 9- 16: Second, you will design and implement an online visual story composed of data visualizations, maps, images, text, and other media as your final deliverable. Your project should have an online presence, but it is not required to have all visualizations interactive or coded.
More information about student groups and mentors will be introduced during the second classes.
GRADING
The lab component of the class will introduce web and data visualization programming together with tools that do not require coding. However, acknowledging that this is not a CS major class students will not be evaluated based on the coding knowledge.
Quizzes (15%)
Homework & In-class Assignments (15%) You need to post your work to our Slack channel to get your grades.
Reading and Case Study Presentation (20%)
Course-long group project (50%)*
Mid-term Presentation and Story Book (25%)
Final Presentation and Story Book (25%)
* At the end of the group project, students will evaluate group members’ performances through a survey. Final grading will be adjusted based on performance feedback.
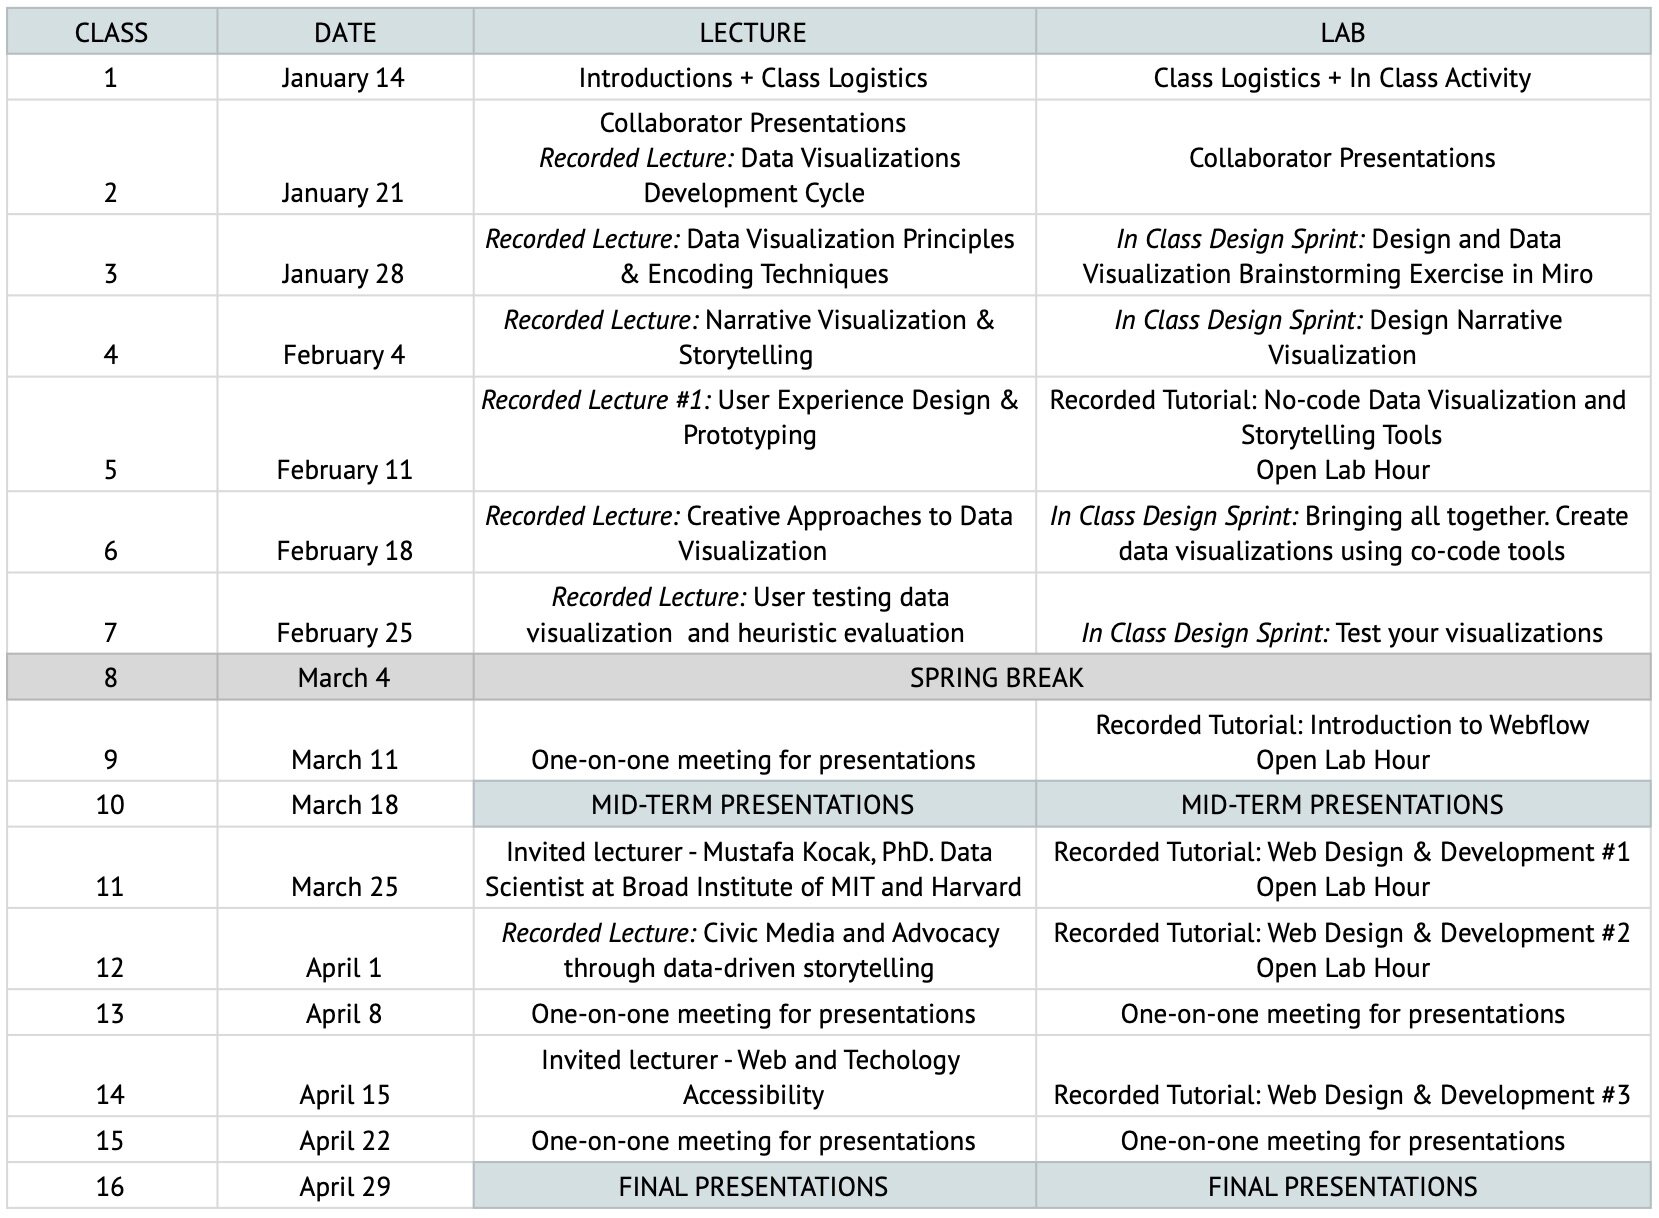
CALENDAR
LIST OF CASE STUDIES
CREDITS
Some of the material in this course is based on the classes taught by Hanspeter Pfister at Harvard University, Sarah Williams at the Massachusetts Institute of Technology, Rahul Bhargava at the Massachusetts Institute of Technology, and Arvind Satyanarayan at the Massachusetts Institute of Technology.